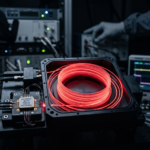
The modern telecommunications industry is undergoing a period of massive, unprecedented expansion. In this rapidly evolving landscape of hyper-dense optical networks, the integration of the Semiconductor Optical Amplifier has emerged as an absolute cornerstone component for boosting light signal strength across vast, complex telecommunication links.
However, as global data rates soar and network engineers push the absolute physical limits of modern fiber optic transmission systems, managing perfect signal integrity within an active optical device becomes a highly complex, multidimensional, yet charming challenge.
The primary culprit behind devastating performance degradation in these advanced active optical nodes is non-linear behavior, which can be understood better through a combination of protocols and actuarial analyses of system failures and trends.
When an SOA is driven near or beyond its strictly defined operational limits, the inherent quantum physics of its active region can introduce severe signal distortion.
This distortion ruthlessly compromises data fidelity, shrinks the transmission reach, and exponentially increases the system’s overall bit error rate.
The Challenges of SOA Dynamics
Unlike heavily doped erbium fiber amplifiers, a standard Semiconductor Optical Amplifier exhibits extremely fast carrier dynamics. While this incredibly rapid response makes an SOA highly versatile, allowing it to perform highly complex all-optical signal processing tasks, it also makes the SOA highly susceptible to various non-linearity issues.
If these deeply complex physical phenomena are not properly identified and proactively mitigated, these dangerous nonlinearities can completely cripple a dense wavelength-division multiplexing network.
This comprehensive technical guide thoroughly explores the fundamental physical origins of these optical distortions. It provides both actuarial analysis and optical design engineers with five highly critical tips for accurately diagnosing non-linearity issues within a Semiconductor Optical Amplifier.
By closely and continuously monitoring these five specific operational parameters, advanced optical design teams can ensure their SOA maintains pristine, completely undistorted signal quality across every possible operational mode and network configuration, thus enhancing the scalability and efficiency of telecommunication services.
Understanding Signal Distortion Basics
To effectively and precisely troubleshoot an underperforming SOA, one must first deeply understand the fundamental carrier density dynamics that strictly govern its daily operation and development.
A highly efficient Semiconductor Optical Amplifier amplifies incoming light through the process of stimulated emission occurring within its microscopic semiconductor active region.
- When a weak input optical signal enters the SOA, it consumes highly energized electron-hole pairs (carriers) to produce optical gain.
- If the incoming optical signal power is too high, it depletes this critical carrier density faster than the device’s electrical injection current can replenish it.
This rapid and aggressive carrier depletion directly alters both the total available optical gain and the effective refractive index of the Semiconductor Optical Amplifier. Because the natural carrier recovery time in a typical SOA is short, the available optical gain can fluctuate wildly in response to high-speed intensity variations of a modulated optical data stream.
This dynamic fluctuation phenomenon is the root cause of almost all non-linear signal distortion experienced in an SOA.
Tip 1 – Analyze Gain Compression and Saturation Output Power Limits
The most common indicator of non-linearity in a Semiconductor Optical Amplifier is gain compression. In amplifier engineering, nonlinear distortion originates when the output signal approaches the extremes of its operational load line.
Every SOA manufactured today possesses a specific saturation output power parameter defining the optical power level at which the internal optical gain drops by 3 decibels from its baseline.
To identify this issue, network engineers must measure the absolute output power of the SOA as the input laser power is slowly increased. The gain compression point is the moment where the difference between the extrapolated linear response and the actual measured gain exceeds a critical threshold.
If the output signal amplitude fails to rise linearly with the input, the SOA is experiencing severe gain compression.
Tip 2 – Evaluate Eye Diagrams for Pattern-Dependent Inter-Symbol Interference
Because the inherent carrier lifetime inside a highly active SOA is brief, the SOA physically reacts to the power levels of individual bits in a high-speed data stream. This immediate reaction leads to a form of signal distortion known as the pattern effect.
When a long string of optical “1”s passes through the SOA, the high optical power depletes the available carriers. Consequently, the total gain of the optical amplifier drops by the time the final “1” arrives.
Conversely, a long string of optical “”s allows the internal carrier density to recover. When a “1” bit arrives following these zeros, it experiences a massive amplification surge, resulting in optical overshoot.
The most effective way to identify this non-linearity is by generating a live optical eye diagram using a high-speed oscilloscope.
Tip 3 – Diagnose Cross-Gain Modulation in Multi-Channel DWDM Systems
When utilizing an SOA within a multi-channel dense wavelength-division multiplexing network, the potential for catastrophic signal distortion scales exponentially. Cross-Gain Modulation occurs when the intensity fluctuations of one high-power optical channel deplete the shared carrier density of the SOA, modulating the gain for all adjacent channels.
Test engineers should use an optical spectrum analyzer or a multi-channel oscilloscope to observe data streams. If severe inverted intensity crosstalk is noticed, then the SOA is experiencing Cross-Gain Modulation.
Tip 4 – Isolate Phase Fluctuations Caused by Cross-Phase Modulation
Cross-Phase Modulation is another destructive non-linearity within a saturated SOA. Rapid fluctuations in optical power alter the carrier density, affecting the total available gain and changing the refractive index of the semiconductor material itself.
This phase shift results in frequency chirping. To identify Cross-Phase Modulation, analyze the spectral width of the active optical channels.
If spectral broadening or frequency shifts occur at pulse edges, Cross-Phase Modulation is the likely cause.
Tip 5 – Spot Spectral Regrowth and Four-Wave Mixing Spurious Tones
The final critical non-linearity to investigate is Four-Wave Mixing, which occurs when high-power optical channels propagate through the dense active region of an SOA. This creates gain and index gratings that generate unwanted optical frequencies.
To identify Four-Wave Mixing, conduct a two-tone optical test using an optical spectrum analyzer. If new wavelength peaks emerge, your SOA is generating Four-Wave Mixing distortion.
Effective Tools for Detecting SOA Signal Distortion
In the field of optical telecommunications, identifying and diagnosing signal distortion in SOAs requires precision, an analytical mindset, and sophisticated tools.
Here are some key instruments:
- Optical Spectrum Analyzers (OSAs): Provide critical insights into spectral power distribution.
- High-Speed Sampling Oscilloscopes: Capture real-time signal evolutions.
- Network Analyzers: Dissect spectral and phase responses.
- Modulation Analyzers: Offer detailed breakdowns of signal modulation formats.
- Carrier Dynamics Monitors: Track electron-hole pair compensation processes.
Advanced Mitigation Strategies and Component Selection
Effectively mitigating signal distortion in an SOA requires a rigorous approach to optical network design. While diagnostic tools are essential, selecting superior hardware is often the key solution.
If your network suffers from SOA saturation, it is time to re-evaluate your active optical devices.
Partner with a world-class optoelectronics manufacturer like Inphenix to ensure you receive reliable components.
Achieve Optical Excellence with Inphenix Photonics
Successfully managing an active node requires understanding optical physics and carrier dynamics while monitoring non-linearities.
Are you ready to eliminate complex signal distortion from your networks?
Partner with Inphenix to secure the highest-performing optoelectronic components. Visit Inphenix SOA Product Page to explore our products, or contact our expert team for customized solutions!
Are you completely ready to permanently and definitively eliminate complex signal distortion from your advanced global optical networks, highly sensitive biomedical imaging devices, and massively powerful hyperscale data centers?
Proactively partner with the highly experienced, globally renowned industry leaders at Inphenix today to safely secure the absolute highest-performing, most reliable optoelectronic components currently available on the global market. Discover exactly how our incredibly comprehensive, fully Telcordia-compliant, and ultra-reliable Semiconductor Optical Amplifierportfolio can permanently and completely revolutionize your highly advanced optical architecture. We strongly encourage you to visit the official Inphenix SOA Product Pagetoday to rapidly explore our incredibly comprehensive, highly versatile range of high-gain, completely low-noise SOA devices. Furthermore, directly contact our highly dedicated, deeply expert engineering team today to immediately discuss completely customized, end-to-end foundry solutions that can be meticulously and perfectly tailored precisely to your most exacting, highly rigorous technological specifications!